CARTO Styles
CARTO provides data-driven out-of-the-box styling functions for colors. Check the full list of CARTO styles in deck.gl.
Examples
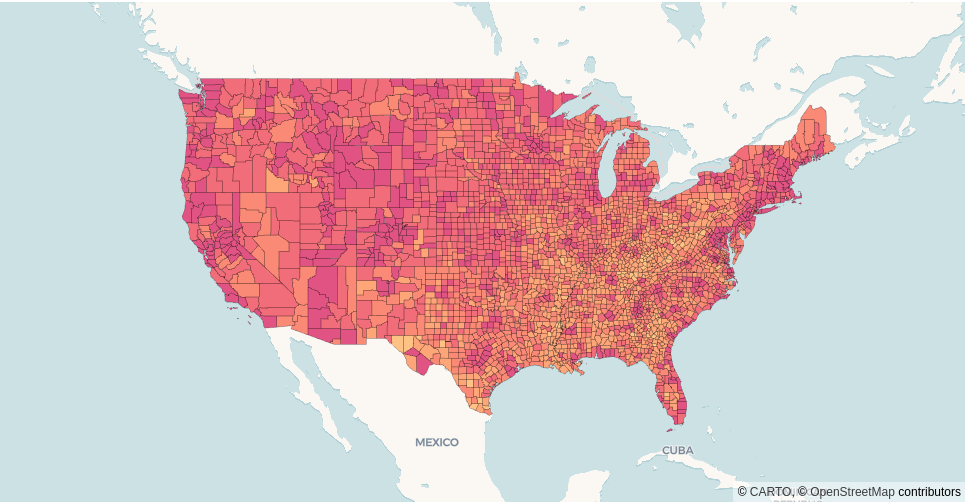
color_bins
import pydeck as pdk
import pydeck_carto as pdkc
from carto_auth import CartoAuth

# Authentication with CARTO
carto_auth = CartoAuth.from_oauth()

# Register CARTO layers in pydeck
pdkc.register_layers()

# Create CARTO data source
data = pdkc.sources.vector_query_source(
    access_token=carto_auth.get_access_token(),
    api_base_url=carto_auth.get_api_base_url(),
    connection_name="carto_dw",
    sql_query="SELECT geom, pct_higher_ed FROM `cartobq.public_account.higher_edu_by_county`",
)

# Render CartoLayer in pydeck with color bins style
layer = pdk.Layer(
    "VectorTileLayer",
    data=data
    get_fill_color=pdkc.styles.color_bins("pct_higher_ed", [0, 20, 30, 40, 50, 60, 70], "PinkYl"),
    get_line_color=[0, 0, 0, 100],
    line_width_min_pixels=0.5,
    pickable=True,
)

view_state = pdk.ViewState(latitude=38, longitude=-98, zoom=3)
tooltip={"text": "Higher education percentage: {pct_higher_ed} %"}
pdk.Deck(layer, map_style=pdk.map_styles.ROAD, initial_view_state=view_state, tooltip=tooltip)
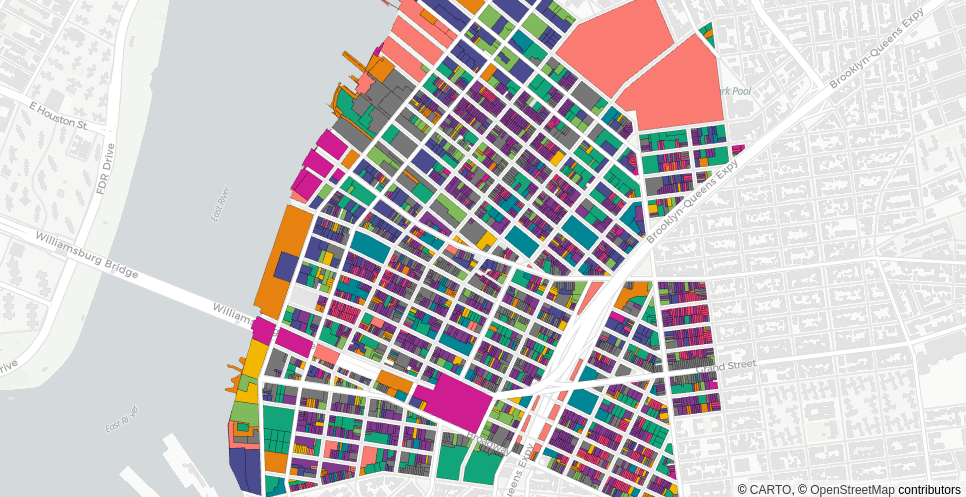
color_categories
# Create CARTO data source
data = pdkc.sources.vector_query_source(
    access_token=carto_auth.get_access_token(),
    api_base_url=carto_auth.get_api_base_url(),
    connection_name="carto_dw",
    sql_query="SELECT geom, landuse_type FROM `cartobq.public_account.wburg_parcels`",
)

# Render CARTO layer in pydeck with color categories style
layer = pdk.Layer(
    "VectorTileLayer",
    data=data,
    get_fill_color=color_categories(
        "landuse_type",
        [
            "Multi-Family Walk-Up Buildings",
            "Multi-Family Elevator Buildings",
            "Mixed Residential And Commercial Buildings",
            "Parking Facilities",
            "1 and 2 Family Buildings",
            "Commercial and Office Buildings",
            "Vacant Land",
            "Public Facilities and Institutions",
            "Transportation and Utility",
            "Open Space and Outdoor Recreation",
            "Industrial and Manufacturing",
        ],
        "Bold",
    ),
    get_line_color=[0, 0, 0, 100],
    line_width_min_pixels=0.5,
    pickable=True,
)

map_style = pdk.map_styles.ROAD
view_state = pdk.ViewState(latitude=40.715, longitude=-73.959, zoom=14)
tooltip={
    "html": "<b>Land use type:</b><br>{landuse_type}",
    "style": {"color": "black", "backgroundColor": "#84D2F6"}
}
pdk.Deck(layer, map_style=map_style, initial_view_state=view_state, tooltip=tooltip)
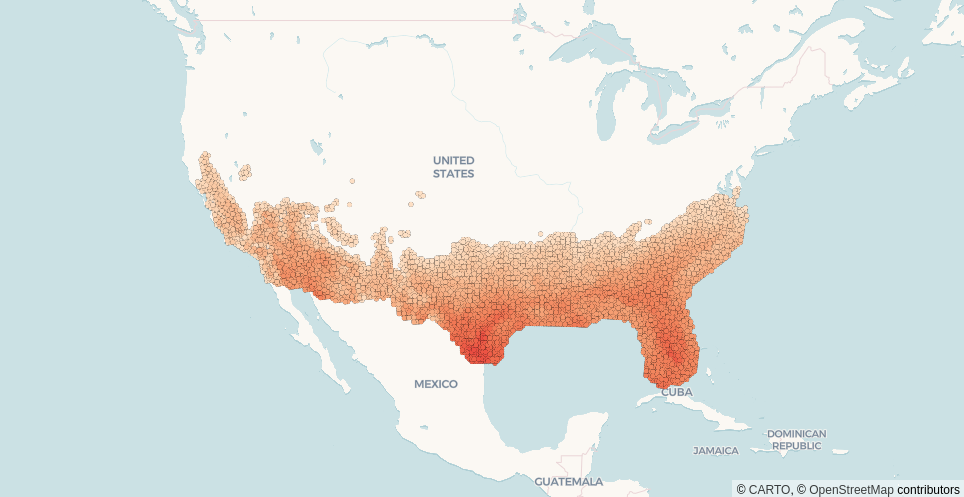
color_continuous
# Create CARTO data source
data = pdkc.sources.vector_query_source(
    access_token=carto_auth.get_access_token(),
    api_base_url=carto_auth.get_api_base_url(),
    connection_name="carto_dw",
    sql_query="SELECT geom, value FROM cartobq.public_account.temps",
)

# Render CartoLayer in pydeck with color continuous style
layer = pdk.Layer(
    "VectorTileLayer",
    data=data,
    get_fill_color=color_continuous("value", [70, 75, 80, 85, 90, 95, 100], "Peach"),
    point_radius_min_pixels=2.5,
    pickable=True,
)

map_style = pdk.map_styles.ROAD
view_state = pdk.ViewState(latitude=34, longitude=-98, zoom=3)
tooltip={
    "html": "<b>Temperature:</b> {value}°F",
    "style": {"color": "white"}
}
pdk.Deck(layer, map_style=map_style, initial_view_state=view_state, tooltip=tooltip)
Reference
- color_bins(attr: str, domain: list, colors: str | list = 'PurpOr', null_color: list = [204, 204, 204])
Helper function for quickly creating a color bins style.
Data values of each attribute are rounded down to the nearest value in the domain and are then styled with the corresponding color.
- Parameters:
attr (str) – Attribute or column to symbolize by.
domain (list) – Assign manual class break values.
colors (Union[str, list], optional) – Color assigned to each domain value. - str: A valid named CARTOColors palette. - list: Array of colors in RGBA
[ [r, g, b, [a]] ]. Default is PurpOr.null_color (list, optional) – Color for null values. Default is [204, 204, 204].
- color_categories(attr: str, domain: list, colors: str | list = 'PurpOr', null_color: list = [204, 204, 204], others_color: list = [119, 119, 119])
Helper function for quickly creating a color category style.
Data values of each attribute listed in the domain are mapped one to one with corresponding colors in the range.
- Parameters:
attr (str) – Attribute or column to symbolize by.
domain (list) – Category list. Must be a valid list of categories.
colors (Union[str, list], optional) – Color assigned to each domain value. - str: A valid named CARTOColors palette. - list: Array of colors in RGBA
[ [r, g, b, [a]] ]. Default: PurpOr.null_color (list, optional) – Color for null values. Default is [204, 204, 204].
others_color (list, optional) – Fallback color for a category not correctly assigned. Default is [119, 119, 119].
- color_continuous(attr: str, domain: list, colors: str | list = 'PurpOr', null_color: list = [204, 204, 204])
Helper function for quickly creating a color continuous style.
Data values of each field are interpolated linearly across values in the domain and are then styled with a blend of the corresponding color in the range.
- Parameters:
attr (str) – Attribute or column to symbolize by.
domain (list) – Attribute domain to define the data range.
colors (Union[str, list], optional) – Color assigned to each domain value. - str: A valid named CARTOColors palette. - list: Array of colors in RGBA
[ [r, g, b, [a]] ]. Default is PurpOr.null_color (list, optional) – Color for null values. Default is [204, 204, 204].